Guide to Economic Order Quantity in Inventory Management
Insights into Economic Order Quantity
Businesses need to look closely at how they can optimize their inventory management to maximize their profits.
Stock mismanagement can cause overstocking and understocking of products, leading to wasted time, resources, and capital. Inventory distortion, including stockouts and overstock, has cost businesses around the world over $1.1 trillion. Implementing inventory control systems to place appropriate stock orders can help prevent such losses.
Reducing expenditures such as inventory purchasing and holding costs can also maximize a business's profit margin. To calculate the optimal order quantity accurately, companies should use the economic order quantity (EOQ) method. This method aims to minimize ordering and carrying costs by analyzing the stock's set-up cost, production cost, and demand rate.
This article will explain the importance of EOQ, how it affects a business's bottom line, and how to implement it properly.
What is Economic Order Quantity and How Can it Help?

Economic order quantity is the ideal purchasing quantity of products to avoid under and over-stocking. An optimal ordering point will also reduce related expenses such as inventory, carrying, and shortage costs.
Ford W. Harris first developed the original model in 1923, which held the level of demand and prices constant. The method was modified several times to calculate different production levels, order intervals, and variable costs for larger companies. Its calculations have benefits for companies of all sizes, including-
- Inventory cost reduction - EOQ is a cash flow tool that helps businesses find where expenses can be saved within inventory, like capital tied up in under-stocking, overstocking, missing products, ordering, and holding fees. When the EOQ is calculated properly, a company can determine exactly how much of each product they need to save on unwanted expenditures. As the day's inventory outstanding, or the length of time businesses hold stock before it is sold, increases, products take longer to convert to cash and take up valuable space. Capital saved from ordering and holding stock can be used elsewhere to expand the business.
- Customer satisfaction - When the optimal stock level is determined, businesses can adequately meet customer demand. The formula can help enterprises calculate how much inventory they should maintain and decide when to place orders. With this information, companies can avoid dissatisfied customers by preventing stockouts, late shipments, and backorders. As long as businesses maintain their optimal stock levels, customer trust and loyalty will increase, boosting company sales.
- Improved productivity - Correct EOQ calculations mean companies have enough inventory on-hand to operate efficiently. As sales naturally ebb and flow throughout the year, the formula accurately determines how the stock levels should reflect the forecasted sales. Therefore, the warehouse can avoid shortages or excess products that could disturb business productions.
How to Use the EOQ Formula
To minimize the total cost per order, the following components must be included in the EOQ formula-
D = Annual demand in units
S = Order cost per purchase (fixed cost)
H = Holding cost per unit (variable cost)
Q = Order volume
C = Unit cost (variable cost)
i = Carrying cost (interest rate)
Ordering Cost
Ordering cost within the formula is often a fixed variable and represents the cost of placing and receiving an order. This includes every effort it takes to place an order, from time and resources spent corresponding with vendors to receiving the delivery.
If a business does not know their annual ordering cost, they must first determine their number of orders annually. The annual number of orders for an item is calculated by dividing the annual demand by the volume per order-
Number of Orders = D/Q
For orders with a set cost that does not depend on the number of units, the annual ordering cost is formulated by multiplying the number of orders by the set cost-
Annual Ordering Cost = D/Q x S
Once the annual ordering cost is determined, businesses need to find precisely how much they are spending to store their inventory.
Holding Cost
Holding cost, also known as storage or carrying cost, is the amount a business spends on warehousing fees to store their inventory. Holding costs can also consider opportunity cost, which refers to money that is potentially lost when one product is bought instead of another.
Storage cost is a dependent variable that is directly proportionate to how much inventory is on-hand. In other words, the more inventory a company has in the warehouse, the higher the cost of holding. Therefore, businesses must take the time to determine the appropriate level of stock to hold on-site.
Holding cost per unit is formulated by multiplying the cost per unit by the interest rate-
H = iC
Assuming consumer demand remains constant, the stock will decrease over time at a steady rate. This trend allows management to determine when stock will reach zero and schedule re-order points.
Next, businesses need to figure out their annual holding cost by multiplying the holding cost per unit by half of the order volume-
Annual Holding Cost = Q/2 x H
Total Cost and EOQ

Once the annual ordering and holding costs are formulated, combining the two expenditures produces the total cost of orders-
Annual Total Cost = D/Q x S + Q/2 x H
Then, the EOQ can be calculated by dividing the annual cost by the order volume with respect to the sales frequency (d). This equation is further simplified by taking the square root of 2 times the quantity of the annual demand and ordering cost, divided by the holding cost-
EOQ = dTC/dQ = (2DS/H)
For example, if a company has a demand of 3,000 units annually and it costs them $700 for every placed order and $100 per unit at a 10% interest carrying cost, their EOQ model would be-
D= 3,000
S= $700
C= $100
H= $10
i= 10%
Q=q
Different quantities can be plugged into "Q" to find what volume per order generates the economic order quantity with the lowest total cost.
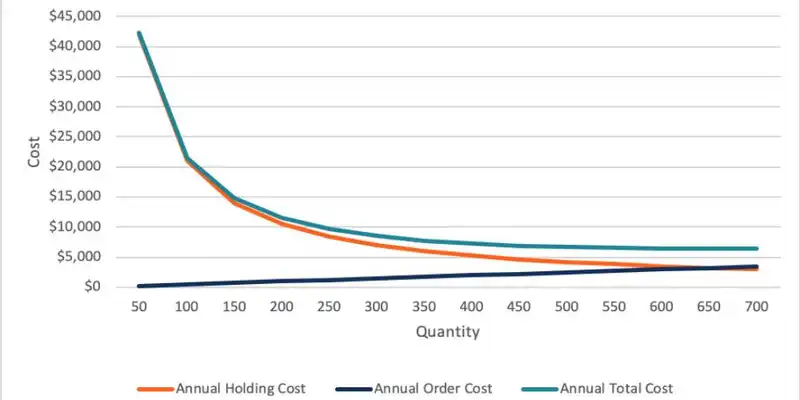
Spreadsheets can be used to calculate figures for all components of this method. A line graph can then be generated from the data producing three lines for annual holding cost, annual order cost, and annual total cost. The point where the yearly costs holding and order intersect shows the business's recommended EOQ.
In this example, the ideal volume order (Q) is 650 units ordered five times annually, costing the business a total of $6,481.
EOQ- 648.07 Units (Rounded up to 650) = ((2($3,000)($700))/($10)
Total Cost- $6,481 = (($3,000)/650 x ($700)) + 650/2 x ($10)
Shortcomings of Economic Order Quantity
The EOQ model is a useful tool for companies looking to minimize their total cost; however, there are other factors to keep in mind that the formula doesn't calculate. This model keeps the consumer demand at a constant, assuming that sales are forecasted to remain the same all year round. However, this is not a reality for most businesses.
The ordering quantity algorithm also assumes vendors and third parties do not fluctuate their ordering and holding costs. These assumptions make it difficult for businesses to make an accurate prediction of the total cost.
Variables such as seasonal changes in sales, inventory discrepancies, discounts, and third-party fees aren't taken into account but should be considered when calculating the total cost.
Consequences of Poor Inventory Management and Ordering

Regardless of the type of business, inventory control directly affects profits. Mismanaging inventory and stock orders can cost businesses potential sales and unnecessary fees. Finding a happy medium between understocking and overstocking is a science but vital to the business' prosperity.
Understocking
Understocking not only leaves customers unsatisfied but can also decrease customer loyalty and give competitors more business as a result. In the restaurant industry, understocking a product means they cannot prepare any dishes containing that ingredient, costing them potential sales.
Similarly, in the retail business, understocking an item could result in a stockout blunder or late shipments due to re-ordering popular items too late. Studies show that 34% of businesses had to ship customer orders late due to understocking. In this case, a business' order cost can increase by having to expedite shipping to meet the demand.
Sometimes understocking is not the business' fault, but rather due to a sudden change is customer demand that couldn't be forecasted. However, companies should have adequate sales and stock reports that management monitors to predict demand trends and re-order points. It is also advisable for businesses to order early and in large quantities to save on related ordering and shipping costs. Companies can often find lower prices on inventory when they order early before items hit their peak seasons.
Overstocking
On the complete opposite end of the spectrum, overstocking also leads to profit loss. An overstocked product has a higher risk of getting lost or damaged, requiring investments to find the cause of the inventory discrepancy.
In retail businesses, items that aren't sold can become obsolete, decreasing turnover rate and costing the company extra warehousing fees. Even though items can be stored off-site in hopes of demand in the future, inventory depreciates with time from wear and tear.
On the other hand, the food industry does not have the option of warehousing excess stock as they work with perishables. Overstocked ingredients usually have a short shelf like and, if not sold, have to be disposed of, putting the business in a deficit.
When a business understands its consumer demands and can prevent under and overstocking products, it can lower their inventory costs by 10%. Companies can set stock parameters such as minimum and maximum inventory levels to avoid inventory mismanagement.
Benefits of Automated Economic Ordering Software

As a business' inventory and consumer demand increases, so do the need for an automated stock replenishment system. Manually tracking inventory over several locations is not ideal as it can be riddled with human error and take up an excessive amount of time and resources.
Nearly 43% of small businesses either do not track inventory or use a manual system, contributing to the fact that American retail companies only have 63% inventory accuracy.
Human error, such as lack of training, internal theft, and recording mistakes has cost businesses around the world $259.1 billion annually. Implementing an automated stock software can prevent these human errors by limiting the number of people inputting data.
There are several other benefits for businesses implementing automated inventory and replenishment systems, including-
- Reduced process costs - No manual orders need to be placed, saving time and money on hiring employees to make order purchases.
- Flexible reporting - Businesses can set parameters in the system, having reports generated automatically.
- Higher stock turnover rate - Slow-moving inventory is reduced, providing more space for stock with high turnover rates.
- Reduced waste - Excess stock purchase is prevented, saving businesses capital on perished or obsolete goods.
- Customer satisfaction - Stock analysis and automatic re-orders make sure inventory levels match consumer demand.
Features of Automated EOQ Model Software
An automated software system never stops monitoring sales, inventory, and demand. Software is easily integrated with point-of-sale (POS) systems and barcode scanners to track all data from transactions, cycle counts, purchases, and shipments.
All of this information allows the automated replenishment system to determine re-order points and recommended order quantities. Some inventory ordering software also offers additional features, such as-
- Order consolidation - Automated software saves businesses time and resources by offering custom order guidelines that reduce order costs by combining purchases and re-stocking automatically.
- Vendor search - Software can offer the user the option to search for local vendors and request their catalog.
- Product search - If a business and their vendor run out of a highly requested item, management can search for a new vendor based on the product needed.
- Detailed order history - Each order placed in software is saved for reference. Users can look back at each order placed to ensure accuracy. Some software even offers reports for purchase history that includes purchase totals and cost analytics.
- Customizable orders - Businesses can generate automatic re-orders based on product usage, demand, and raw food cost. Restaurants can use the portion control feature that breaks down each menu dish by ingredients to show the actual price spent. This breakdown helps the user accurately decide if a menu item is profitable or needs to be removed.
Avoiding under and overstocked products reduces the businesses' purchase, ordering, and handling costs resulting in higher gross profits.


